 |
Section 1Getting Started |
|
| HOME MAIN TOCHELP |
 |
Section 1Getting Started |
|
| HOME MAIN TOCHELP |
1.3 |
The Nautical Chart |
ProjectionsIt's a challenge for chart makers to transfer the features of a spherical earth to a flat piece of paper. The solution lies in using mathematical formulas to create projections. Different formulas produce different projections and there are many types, each with its particular characteristics. Nautical charts are usually one of three: Gnomonic (pronounced no-monic), Polyconic and Mercator. The Mercator projection is the most common. |
| Find out more about Gerhard Mercator and his projection |
|
|
The Chart at a GlanceA chart identifies navigable areas, shorelines and areas not suitable for navigation. It indicates depths of water, or soundings; the location of rocks and other hazards, tidal drying areas as well as deep water. A chart also points out the location and type of navigational aids, and shows symbols for piers, bridges and other structures. On-shore landmarks that can assist with navigation, such as radio towers and church steeples, are also symbolized. Charts from different agencies (three agencies make charts in the USA) and countries may look different, but there are many common characteristics. |
|
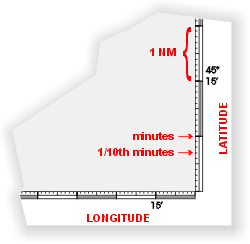
Canadian and US charts are similar and it's not difficult to understand one if you're familiar with the other. Care should be taken to note any difference in scale, units of measurement, date of publication and so on. A chart is usually printed on durable paper to make it water resistant. It's numbered for reference to a catalogue, has titles of the major and minor areas of coverage and states its publication date. A grid of latitude and longitude is overlaid on all charts. In most nautical projections, parallels are graduated along the sides of the chart. Longitude is graduated along the top and bottom of the chart. The subdivisions of these scales are in degrees, minutes, half-minutes, and tenths of minutes, or seconds in older charts. |
|
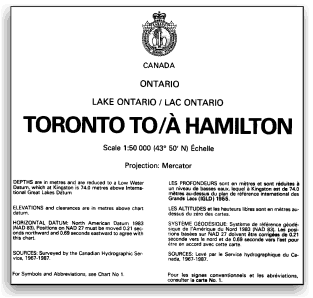
The scale of this coastal chart is 1:50 000. |
The Title BlockOne prominent feature of a chart is the title block. It contains information on the area of coverage, the scale of the chart, the type of projection, the reference level for soundings and the units of depth and elevation measurement: metric or imperial. It also lists any cautionary notes. Datum and SoundingsChart datum is defined as the level below which water seldom falls. Soundings refer to depths at datum. ScaleA chart can cover a large area — all of Lake Huron, for example — or a detailed representation of a smaller area. The difference in coverage area relates to a chart's scale. |
|
A chart's scale is the ratio of the distance on a chart to the distance on land or water. A scale of 1:8 000 means that the chart is one eight-thousandths of the size of the area it represents: Objects shown as a centimetre apart are physically 8,000 centimetres (80 metres) apart. A coastal chart usually has a scale of between 1:50 000 to 1:150 000. The scale of a harbour chart is typically 1:10 000. |
|
A chart that provides a lot of detail for a small area is a large scale chart. A chart that covers a vast area and provides little detail is a small scale chart. Remember: |
| large scale - small area, small scale - large area. |
|
The same geographic area may be covered by several charts with differing scales. |
| One of navigation's golden rules: use the chart with largest scale available. |
SymbolsCharts use symbols to represent real-world objects. Knowledge of these symbols, as well as their common abbreviations and terminology, is an important part of using a chart. Symbols are covered in lesson 2.2. |
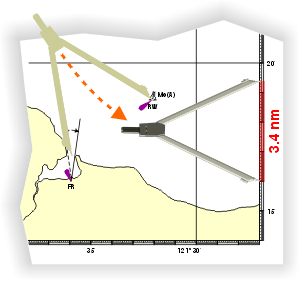
Measuring DistanceBecause a chart is a scaled representation of the real world, it can be used to measure distances between objects. This is useful, among other things, for estimating sailing or motoring time between points. On a Mercator chart, the latitude scale on the
sides of the chart serves as the distance scale. It's worth remembering that only the vertical, latitude scale on a Mercator chart can be used to measure distance, not the horizontal longitude scale. This is because each minute of latitude equals one nautical mile, while the distance between minutes of longitude decreases between the equator and the poles. Dividers are used to transfer the distance between two charted objects to the latitude scale on the side of the chart, or from the latitude scale to any points on the chart. |
|
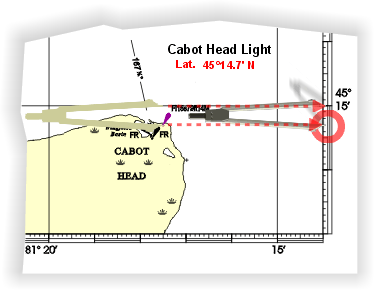
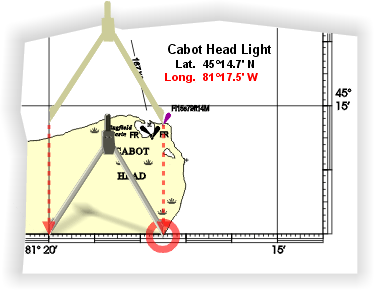
Finding Co-ordinatesDividers are also used to transfer a position's latitude and longitude co-ordinates to a chart or to find a position's co-ordinates. Charts have a grid of reference lines that make it possible to transfer co-ordinates with precision. |
|
The latitude of the light at Cabot Head is found by placing one point of the dividers on the light's chart symbol and the other on the nearest latitude reference line. The dividers are then transferred to the side of the chart and the latitude noted from the scale. |
|
To find the longitude the process is repeated using the vertical reference line and the scale at the bottom or top of the chart. |
Charts and ChangeCharts get out of date quickly: buoys are moved, removed or changed, shorelines shift or new hazards appear. Lesson 1.4 examines how Notices to Mariners inform boaters of changes to charts between publications. In Canada CHS charts are revised to include changes made between publications. The year of these revisions is printed in the lower left-hand corner of the chart. |
| MAIN TOC SECTION TOCPREV LESSONNEXT LESSON HELP |